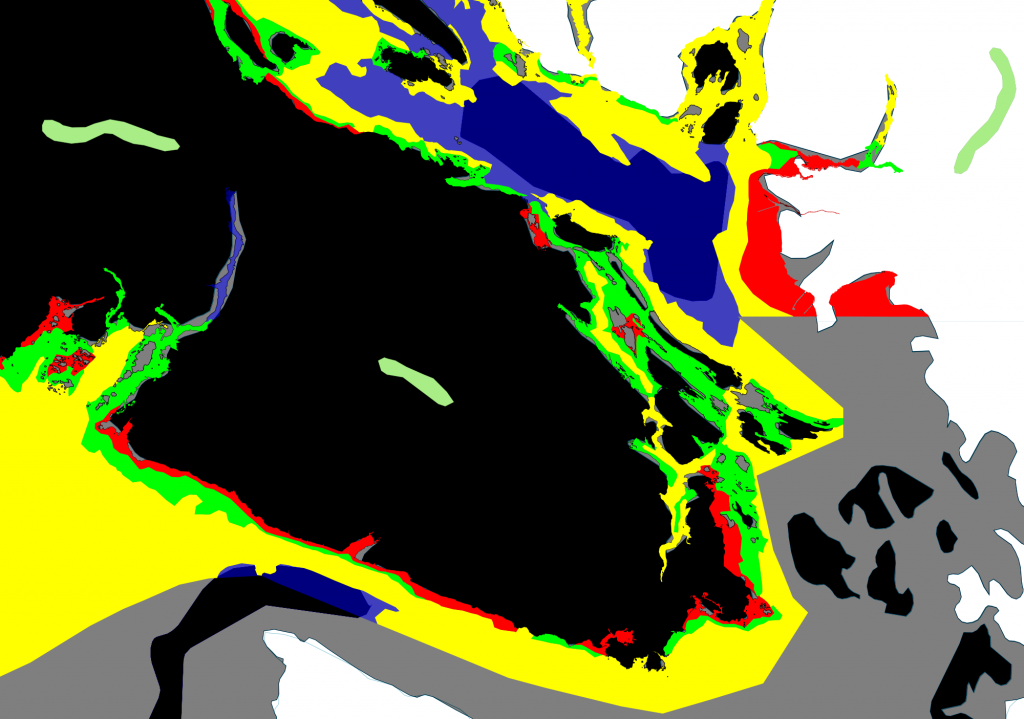
This weekend I have been playing with more Open Data and Maps using TileMill. Specifically I been trying to make a Bathymetric map of the Salish Sea (BC Coastal waters)
A bathymetric chart is the submerged equivalent of an above-water topographic map. Bathymetric charts are designed to present accurate, measurable description and visual presentation of the submerged terrain. In an ideal case, the joining of a bathymetric chart and topographic map of the same scale and projection of the same geographic area would be seamless. The only difference would be that the values begin increasing after crossing the zero at the designated sea level datum. Thus the topographic map's mountains have the greatest values while the bathymetric chart's greatest depths have the greatest values. Simply put, the bathymetric chart is intended to show the land if overlying waters were removed in exactly the same manner as the topographic map. Source: http://en.wikipedia.org/wiki/Bathymetric_chartI have been struggling to find Bathymetric data that covers both Canada and USA coastal regions for the Salish Sea. The USA data is easy to find and highly detailed but finding data that matches up with Canadian data has been next to impossible. Even finding data was difficult in the first place.
I was able to fine some low detail layers for 0 Meters and 200 Meter for North America from naturalearthdata.com that are useful for plotting out the major elements.
I also found some highly detailed coastal layers from Vancouver Open Data catalog that I used for the finer details around Vancouver.
Next I added Coastal BC Bathymetry data from DataBC but the files did not import in to TileMill correctly, and the "Depth" column got corrupted. Super annoying as it was the main column I was interested in. I had to spend a few hours learning about .shp and .dbf files and was eventually able to edit the file to make it work sort of.
 BC Open Data catalog is weird in that I had to add the data to a shopping card, then "check out" the data with my email address and wait for a link to arrive in my email. The link came quickly taking at most 25mins. I still found the process strange as most of the other open data sites let me download it directly.
Currently I have only included the Canadian data as Its been exceedingly difficult to match it up with the US data.
This map still needs a lot of work to get it right. I am expecting to have to do a lot of optimization in InkScape afterwards. Each colored layer will be a different layer of plywood and stacked on top of each other glued in to place with "Ground level" layer being the top visible layer. I am still debating if I should leave all the little islands on the map as they will dramatically add to the complexity of the map.
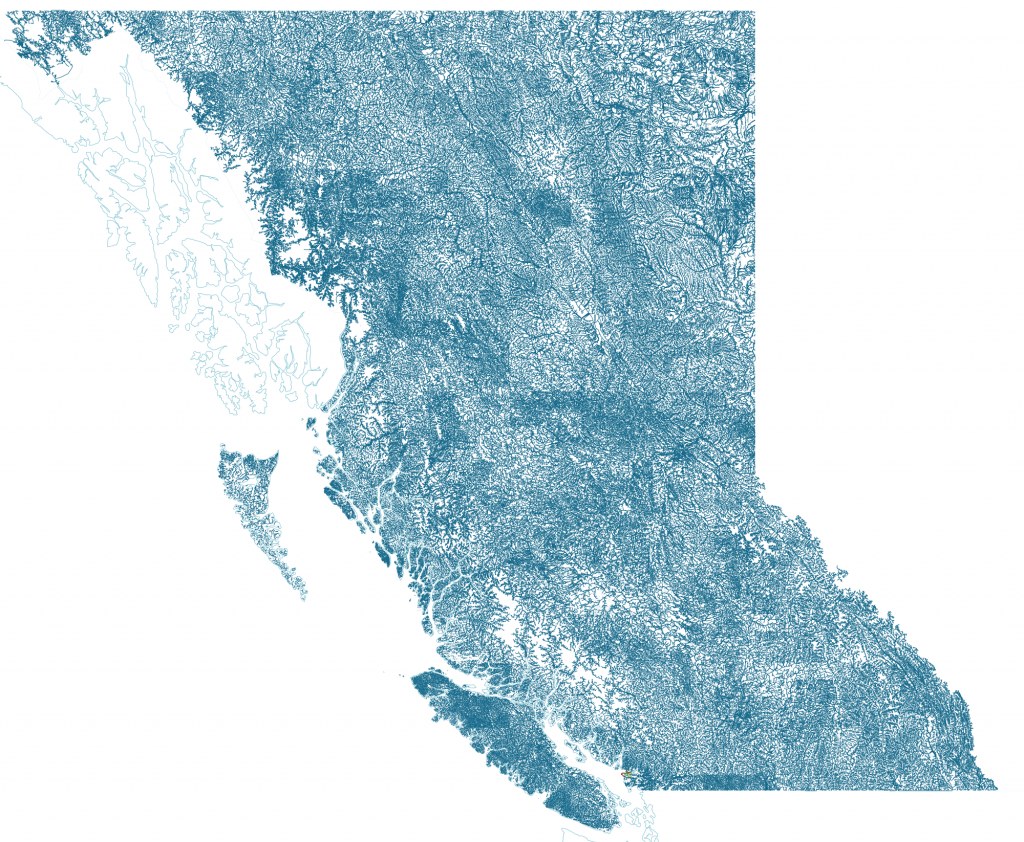 I want to add some complexity to the top "ground level" layer so its not just a normal sheet. I was thinking about adding rivers and lakes to the top layer to add some details. I found the river data on DataBC website.
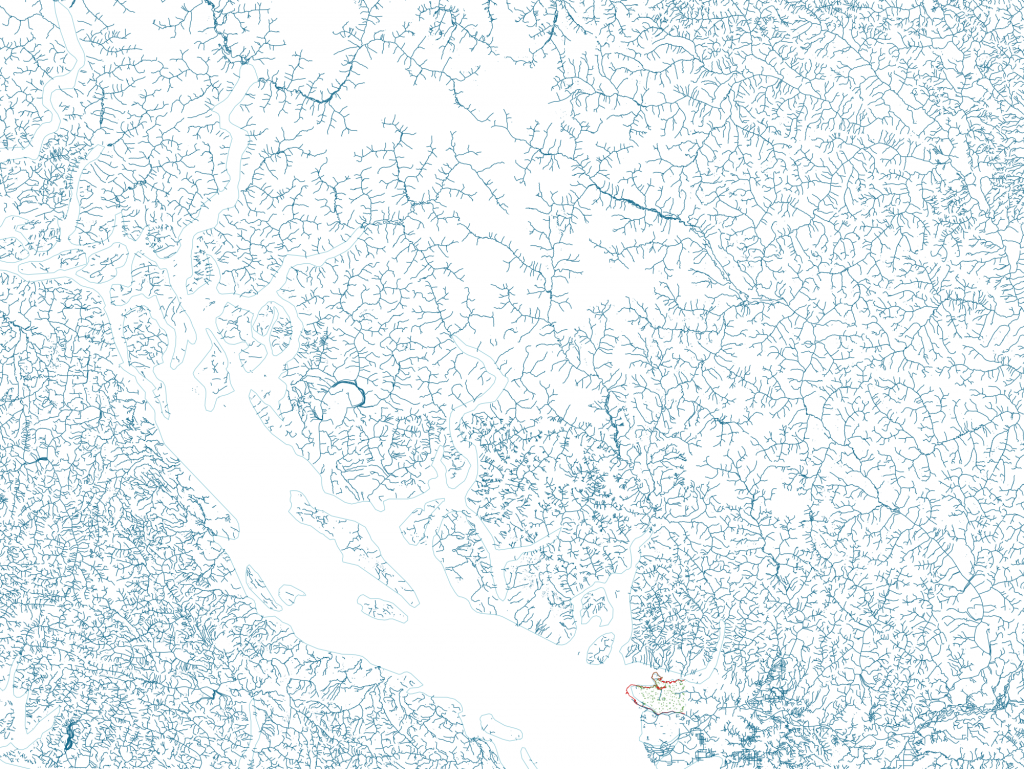 The river data looks beautiful but to complex and there doesn't seem to be a way of differentiating between rivers and streams.