Productivity tracking
This chart was generated with the help of Rescue Time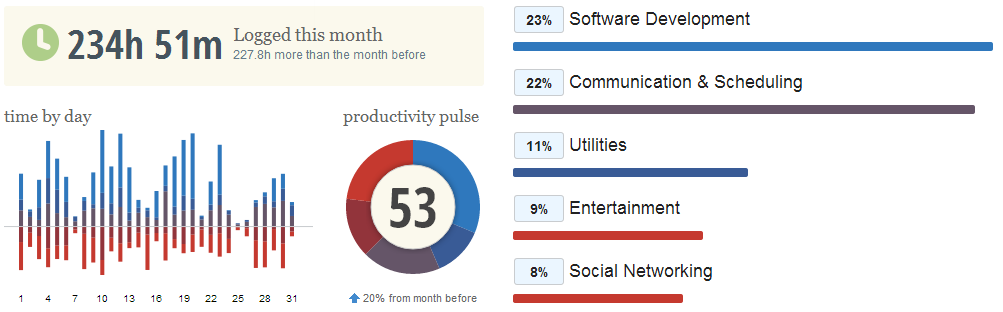
Top used apps on PC and Phone
- Sublime_text
- Putty
- Gmail
- pidgin-portable
- Google Talk for Android
- GMail for Android
- Google Chrome
- Visual studios 2010
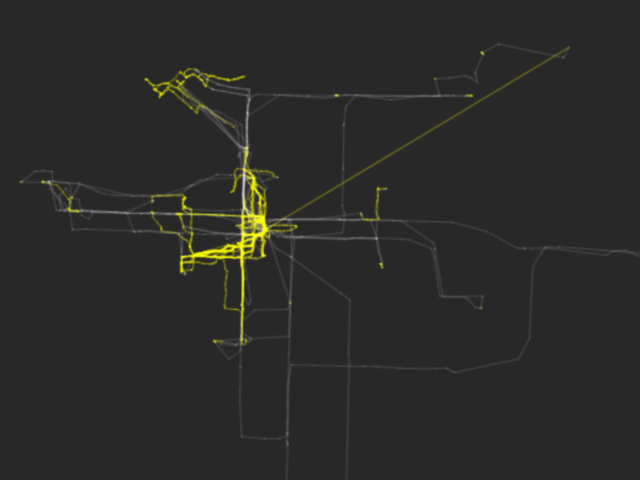
This image shows my movement around Vancouver in December 2013. The image was created with processing using a script from MMapper based on data that was recorded with the Moves app on my cell phone.
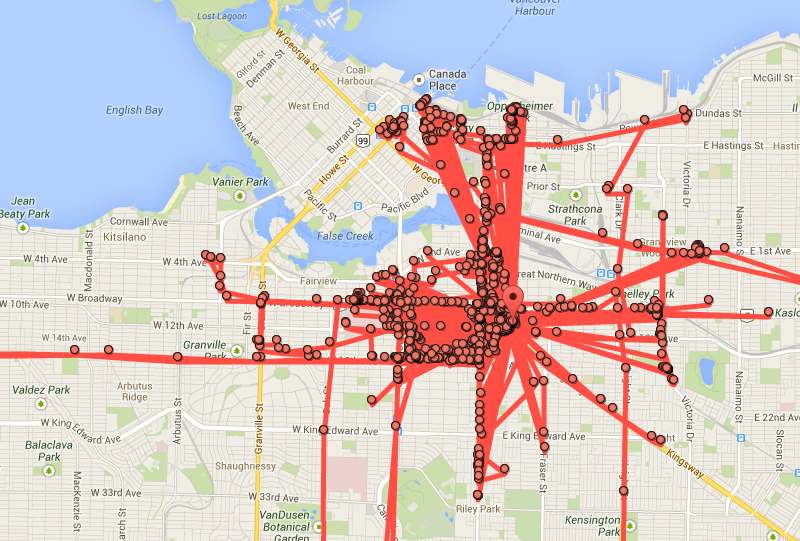
This chart of where I spend most of my time was generated with http://www.moves-export.com using the data provided by Moves app. A good week for steps should be 70,000
| Week | Home | Work | Other Places | Travel | Fitness | Steps |
|---|---|---|---|---|---|---|
| Dec 29, 2013 to Jan 4, 2014 | 69 h 1 min | 18 h 15 min | 52 min | 4 h 41 min | 28,223 | |
| Dec 22, 2013 to Dec 28, 2013 | 139 h 33 min | 4 h 48 min | 15 h 24 min | 2 h 38 min | 5 h 34 min | 38,249 |
| Dec 15, 2013 to Dec 21, 2013 | 102 h 0 min | 33 h 40 min | 22 h 4 min | 1 h 30 min | 7 h 29 min | 60,617 |
| Dec 8, 2013 to Dec 14, 2013 | 99 h 5 min | 26 h 13 min | 23 h 5 min | 3 h 43 min | 6 h 22 min | 50,506 |
| Dec 1, 2013 to Dec 7, 2013 | 89 h 38 min | 31 h 30 min | 26 h 7 min | 3 h 53 min | 4 h 38 min | 45,932 |
Search patterns
This image is generated from Google's search history page.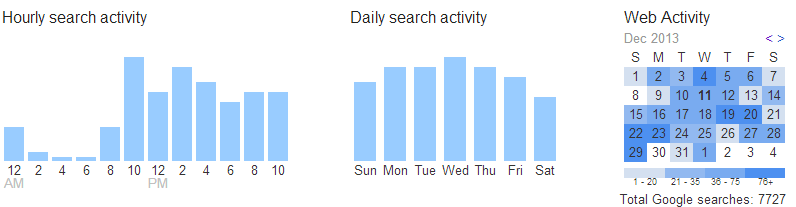
BC Hydro
This map was created by BC Hydro usage monitoring with a smart meter.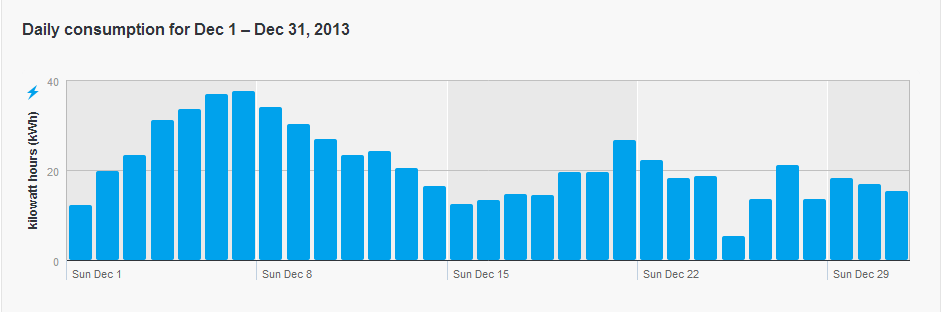
House sensors
The temperature of my house, recorded with a 1wire temperature sensor and a Raspberry PI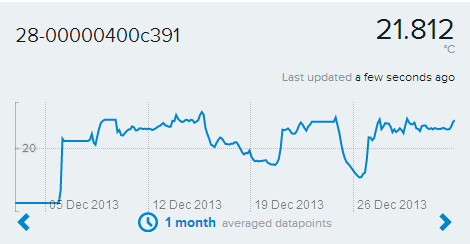
Sleeping
Total sleep time: 207.2 hours Average daily sleep: 8.3 hours Avg. sleep/record: 6.9 hours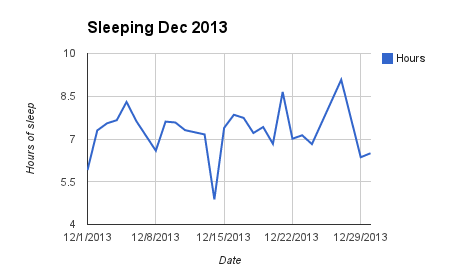
Generated with the help of an android app called Sleep Bot
Other
Gmail disk usage increase: 116mb